
Comparing UK Greyhound Tracks — Oxford vs Hove, Romford and Monmore
 Available in US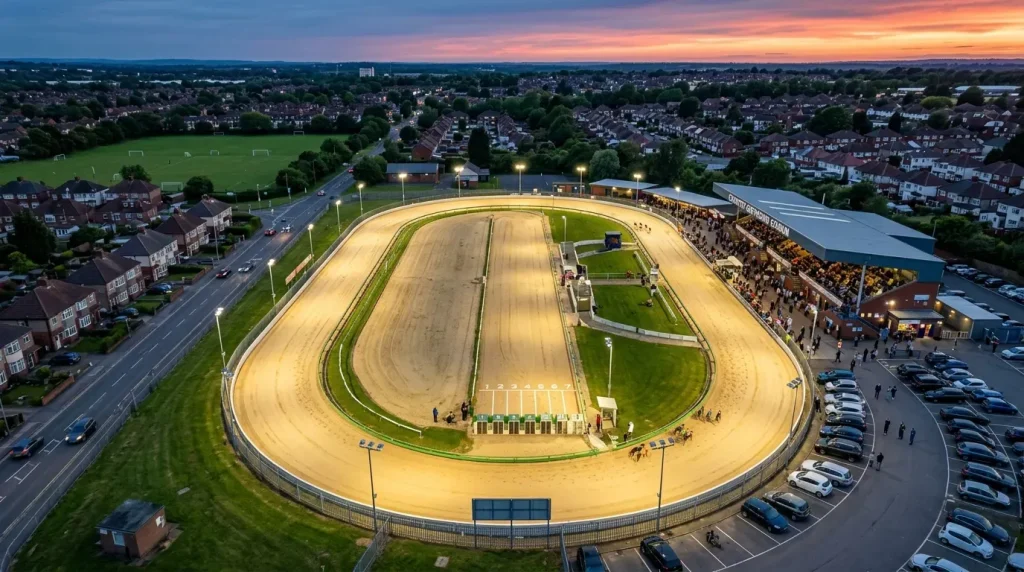
Every UK greyhound track has its own personality — a combination of circumference, surface, bend geometry and distance menu that produces a unique racing character. A dog that thrives at Romford may struggle at Monmore Green. A form figure achieved at Hove does not translate directly to Oxford. For punters who follow greyhound racing across multiple venues, understanding these differences is essential. For those who specialise in a single track, knowing how it compares to the competition sharpens their edge.
There are currently 18 GBGB-licensed tracks in the UK, and Oxford sits among them as a mid-sized venue with distinctive characteristics. This guide compares Oxford directly with three other prominent BAGS tracks — Hove, Romford and Monmore Green — across the measurements that matter most for form analysis and betting.
Four Tracks Side by Side — Key Measurements Compared
Oxford Stadium, according to its Wikipedia entry, has a circumference of approximately 397 metres, runs on a sand surface with an outside Sumner hare and offers three racing distances: 253, 450 and 650 metres. It was built in 1938 and reopened in 2022 after a ten-year closure. These are the physical parameters that define Oxford’s racing character, and they serve as the baseline for comparison.
Hove, located on the south coast near Brighton, is one of the longest-established tracks in the country. Its circumference is approximately 450 metres — significantly larger than Oxford — which produces wider, more sweeping bends. The larger circuit means dogs lose less momentum on the turns, and the trap bias tends to be less pronounced because the bend geometry is less extreme. Hove runs on sand and offers standard distances of 285, 500 and 695 metres, which are longer than Oxford’s equivalents. A punter transferring form data from Oxford to Hove needs to account for the different distances, the different circumference and the different surface characteristics, even though both tracks use sand.
Romford, in east London, is a compact track with a circumference of approximately 375 metres — smaller than Oxford. The tighter bends amplify the influence of the trap draw, and Romford’s trap bias data typically shows a strong inside advantage, with traps 1 and 2 performing well because the tight turns reward dogs that find the rail early. Romford runs on sand and offers distances of 225, 400 and 575 metres. The 225-metre sprint is even shorter than Oxford’s 253, which makes it a pure trap-break race with almost no room for recovery.
Monmore Green, in Wolverhampton, has a circumference of approximately 420 metres — larger than Oxford and slightly smaller than Hove. It is a well-regarded BAGS track with a reputation for competitive grading and consistent racing. Monmore runs on sand and offers distances of 264, 480 and 630 metres. The slightly larger circumference produces gentler bends than Oxford, which tends to reduce the trap 5 advantage and produce a more evenly distributed trap bias.
The key differences across these four tracks come down to three variables: circumference (which determines bend tightness), distances (which determine race character) and surface condition (which determines how weather affects going). Oxford’s 397-metre circumference places it in the middle of the range — tighter than Hove and Monmore, wider than Romford. Its distances are the shortest in this comparison group, which gives it a distinctive sprint identity that the other three tracks do not share to the same degree.
Trap Bias Across Tracks — Where Oxford Stands Out
Oxford’s trap bias is among the most asymmetric of any BAGS track. Trap 5 wins 23.5% of graded races, against a theoretical average of 16.67% in a six-dog field. That 6.8-percentage-point premium is a substantial edge — it means trap 5 wins nearly 50% more often than the statistical baseline predicts. At the other end, trap 6 wins just 16.0%, slightly below the expected rate.
At Romford, with its tighter circumference, the bias tends to favour the inside traps more strongly. Traps 1 and 2 typically outperform at Romford because the acute bends reward dogs that break cleanly to the rail and hold a tight line. The outside traps at Romford face a longer path through each bend, which compounds over the multiple turns of a standard-distance race.
Hove’s larger circumference produces a more balanced trap distribution. The wider bends give outside-drawn dogs more room to manoeuvre, and the bias — while still present — is less dramatic than at Oxford or Romford. Hove’s trap data tends to show a modest inside advantage at sprint distances and a near-even distribution over the standard trip, which makes it a track where form and class matter more than trap draw.
Monmore Green sits somewhere between Hove and Oxford. The bias is present but moderate, with no single trap dominating to the extent that trap 5 does at Oxford. This makes Monmore a track where systematic trap-bias strategies are less profitable and where punters need to rely more heavily on individual form assessment.
For punters who bet across multiple tracks, these differences are not just interesting — they are actionable. A trap-bias strategy that produces consistent returns at Oxford may fail at Hove, where the bias is weaker, or need inverting at Romford, where the inside is king. The data is available through Greyhound Stats UK for each track, and building venue-specific models is the foundation of professional multi-track betting.
Which Track Suits Your Betting Style?
The best track for your betting depends on the style of analysis you prefer and the bet types you favour. Sprint specialists should gravitate toward Oxford’s 253-metre trip, where the trap draw is decisive and the racing is pure speed. If you prefer staying races with tactical complexity, tracks that offer longer distances — Hove’s 695 metres or Monmore’s 630 metres — provide more material to work with.
If your strength is trap-bias exploitation, Oxford is the most rewarding venue in this comparison group. The pronounced trap 5 advantage creates a persistent statistical edge that is large enough to build a systematic strategy around. At tracks with weaker biases, you need additional variables — trainer form, going data, individual dog speed — to find value.
If you prefer form-based analysis where the best dog wins regardless of the draw, Hove is the strongest option. The wider bends and more balanced trap distribution mean that class and current form carry more weight than starting position, which rewards the punter who does the most thorough racecard homework. Romford and Monmore each offer their own mix of characteristics, and the serious multi-track bettor will develop a feel for each venue’s personality over time.
The underlying principle applies everywhere: no two tracks are the same, and form achieved at one venue does not transfer directly to another without adjustment. The data is there for anyone willing to build venue-specific models — Greyhound Stats UK publishes trap bias, fastest times and trainer leaderboards for every licensed track. The punters who invest the time to learn each track’s character are the ones who consistently outperform those who treat the BAGS schedule as a single homogeneous product.
The wider context is set out in our Oxford dogs results guide.
Oxford’s own bias is measured in trap statistics.
